Abstract : Currently, feed flavorings are widely used in feed production. , To achieve the effect of increasing feed intake and appetite in livestock and poultry , It is crucial to continuously improve the detection of fragrance components. This article describes how gas chromatography can be used to determine the concentrated fragrance components in feed. , Conducting specific methodological research , And offer some suggestions for reference.
Keywords : Feed flavoring agents; aroma compounds; detection methods; research
1 Detection of Aroma Components in Feed Flavoring Agents
1.1 The Necessity of Detecting Aroma Compounds in Feed Flavoring Agents
As an appetite stimulant, feed flavoring agents attract animals to the feed, inducing feelings of hunger and comfort while also boosting the secretion of saliva and digestive juices. They enhance palatability, ensuring that animals maintain optimal feed intake even under stressful conditions such as high temperatures, weaning, transportation, or illness. Additionally, these agents effectively mask any undesirable tastes in the feed, leaving it with a rich, sweet, and aromatic scent.
Moreover, they create a consistent aroma, helping livestock and poultry smoothly adapt to changes in feed formulations or raw ingredients—thus facilitating earlier weaning and encouraging young animals to start eating sooner. Beyond their functional benefits, feed flavoring agents can also serve as a key product identifier, making feed products more competitive in the market.
Feed flavoring agents are complex mixtures composed of fragrances, flavorings, and various taste-enhancing substances, often incorporating solvents and carriers. They typically include multiple individual raw materials, among which ethyl maltol, ethyl lactate, and ethyl vanillin have already gained widespread use in feed flavoring formulations. Notably, ethyl maltol itself possesses a particularly robust, caramel-like sweetness with a deep, roasted aroma. , And it can also enhance the effectiveness of other fragrance components, therefore , Ethyl maltol is essential in feed flavorings, while ethyl lactate is primarily a commonly used fragrance base component in feed aroma compounds. Ethyl vanillin, on the other hand, possesses a much stronger vanilla-like scent, typically exhibiting an aroma intensity that surpasses that of vanillin itself. 3 To 4 Around double the amount, it exhibits excellent fragrance-fixing and aroma-enhancing properties, making it a crucial fundamental ingredient in feed flavorings.
1.2 Research on Detection Methods
Currently, China does not yet have a comprehensive standard or method for detecting the active ingredients in feed flavoring agents. Many existing methods for testing these additives lack specificity and effectiveness—most notably, there are no established standards or techniques for identifying ethyl maltol, ethyl lactate, and ethylvanillin in feed flavorings. In recent years, China's food industry has only gradually introduced product standards and detection methods tailored to individual flavoring components.
In contrast, developed countries abroad have conducted relatively limited research in this area, with their focus primarily on analyzing specific compound constituents. Common analytical techniques used for such component checks include gas chromatography, gas chromatography-mass spectrometry, liquid chromatography, liquid chromatography-tandem mass spectrometry, and UV spectrophotometry—though these methods are predominantly applied to food products rather than feed additives. To date, gas chromatography remains an exceptionally rare tool for detecting ethyl maltol, ethyl lactate, and ethylvanillin in feed flavoring agents.
2 Experimental Analysis of Aroma Component Detection in Feed Flavoring Agents
2.1 Experiments and Results
2.1.1 Experiment
The experimental procedure for detecting ingredients in feed flavoring agents begins with properly preparing standard stock solutions and sample solutions. Typically, the standard stock solution is prepared by accurately weighing out each component. 0.25g The reference materials of ethyl maltol, ethyl lactate, and ethyl vanillin are placed in 25ml In the volumetric flask , Then, dissolve it using anhydrous ethanol and make up to volume, ensuring that the concentration ratio of ethyl maltol, ethyl lactate, and ethyl vanillin in the standard stock solution is as follows: 10mg/m l After preparing, store it in the refrigerator; the ideal temperature is 4 ℃. And in preparing the sample solution, you should first weigh out 1g The left and right samples were 25ml In the volumetric flask , Then add 15ml Anhydrous ethanol is thoroughly shaken and extracted using an ultrasonic oscillator, then diluted to the desired volume with anhydrous ethanol, and finally allowed to stand. 5 Hour , Then, carefully remove the upper clear liquid for use. 0.45µm The organic microporous membrane is used for filtration. Additionally, it's important to note: carefully control the chromatographic conditions during the experiment. Typically, a weakly polar capillary column is selected for the chromatographic column in the experiment; the initial temperature of the column oven is set at 50 Around ℃ , Stay 5 Minutes, then at a rate of per minute 10 The temperature rise rate in ℃ has increased to 200 ℃ and maintain 10 A minute's time, ending at one minute per minute 5 The temperature rise rate in ℃ has increased to 200 ℃ and maintain 10 A few minutes' time. The temperature of the gasification chamber should be maintained at 250 Around ℃. The detector's temperature should also be properly controlled. , Usually at 280 ℃. And the initial column flow rate should be controlled at per minute 1ml Right, the分流 ratio is 200:1 。
2.1.2 Result
(1) Linear analysis of the detection method. In this process, the precision of the instrument should be analyzed first. , The specific method is : ① Take a small amount with a concentration of 2 mg/ml The standard solution is prepared according to the selected chromatographic conditions. 6 Next replicate injection , After obtaining the peak areas of ethyl maltol, ethyl lactate, and ethyl vanillin, their relative standard deviations are calculated. , If the results are respectively 1.0% 、 0.8% 、 1.1%, This, therefore, indicates that the instrument's precision meets the requirements. ② Examine the precision of the method. , In this segment, you can do so by selecting fragrance ingredient samples. , The method for preparing the sample solution is carried out using the chromatographic conditions specified above. 6 The next parallel determination , If the relative standard deviations are, respectively, 1.8% 、 2.3% 、 2.1%, The precision of the method meets the requirements.
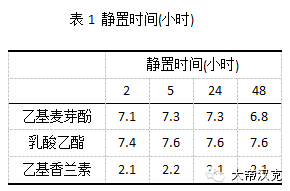
(2) Examination of the stability of the detection method. Stability assessments typically manifest in two aspects: , One is the stability of the standard solution, and the other is the stability of the sample solution. ①In the examination of standard solution stability, you can: 3 mg/mL The standard solution of concentration is stored at refrigerator temperature. 4 °C 3 Months. ② Inject and analyze using the newly configured concentration camera standard solution. , Comparing the new prepared solution and the placed one 3 A month later, the relative deviation is calculated for both the preparation process and the determination of the average value of the sample, based on the concentration value of the old standard solution. If the standard solution is 3 The concentration remains essentially unchanged after one month. , This indicates that the standard solution is stable and effective. The deviations for ethyl maltol, ethyl lactate, and ethyl vanillin should generally be kept within 0.7% 、 1.9% 、 -0.2% Left and right. As for the stability testing of the sample solution, it can be conducted after the sample solution has been prepared. , Let stand separately 2、 5、 24、 48 Sample solution supernatant from hourly analyses is injected for testing. , If the concentration in the sample solution is within 5 Balanced within the hour ,5 To 24 Stable over the hours , Let it sit 48 If the ethyl maltol content decreases after a few hours , The optimal time for analyzing the sample solution is 5 To 24 Within hours. The results are as ( Table 1 ) Shown :
2.2 Analysis and Discussion
2.2.1 Selection of Sample Pre-treatment Methods
Feed flavorings typically come in two forms: solid and liquid. , Solid fragrances are typically categorized into two types: spray-dried and adsorptive. Since solid adsorbents have a higher content of carrier material, , Moreover, the carrier exhibits excellent affinity for the fragrance components. Therefore, it is crucial to effectively and thoroughly extract the fragrance from the carrier. , Research on solid adsorption should also be prioritized.
2.2.2 Selection of Quantitative Methods
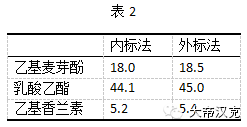
The internal standard method and the external standard method are commonly used quantitative approaches for analyzing components in feed flavoring agents. When using the internal standard method, it is essential to ensure that no interfering peaks appear at the internal standard's retention time within the sample. While the external standard method is relatively simpler to implement during sample preparation, it is often susceptible to variations influenced by factors such as injection volume and instrument performance. Therefore, to effectively evaluate whether these quantitative methods impact the assay results, one can analyze the same sample simultaneously using both the internal and external standard methods. ( Methylcyclopentenolone ) When compared with the external standard method through repeated measurements and averaging, the results showed no significant difference. ( Table 2 As shown ) Therefore, the detection of aroma compounds in feed flavorings should be performed using an external standard method, which is less affected by interfering peaks and involves simpler sample preparation for quantitative analysis.
3 Conclusion
In summary , The aroma component detection method described in this article primarily employs gas chromatography to analyze three key aroma compounds: ethyl maltol, ethyl lactate, and ethyl vanillin. This method is particularly advantageous due to its simplicity of operation and excellent extraction efficiency. Additionally, the analytical method exhibits a wide linear range with outstanding linearity. Given that the relevant instruments and equipment are already widely used across China, this approach can be readily promoted and applied on a larger scale. ( Text / Liu Jinyu)